CORA
CORRESPONDENCE ANALYSIS
THE PRODUCT
CORA is our tool to disclose the relationships between two categorial variables (Correspondence analysis).
FEATURES IN BRIEF
- Supports all the most popular normalisations (symmetrical, asymmetrical: line or column based)
- Clear listing of coordinates and validity of results
- Reports can be compiled in whatever way you choose
- Extensive options for the individual design of charts for optimal presentation of relationships (1, 2 and 3 dimensional scatter charts)
- Multiple export options for results (incl. PDF and Excel), as well as formats for inclusion of charts in a presentation (PowerPoint)
OBJECTIVE
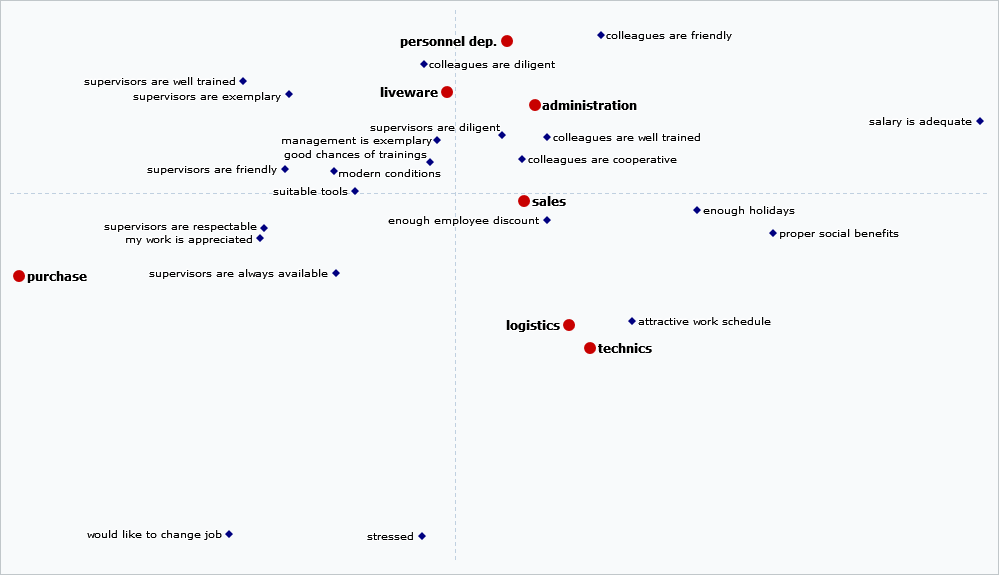
The aim of correspondence analysis is to illustrate the relationships between two categorial variables. These variables can be objects such as groups of persons or evaluated products, or they can also be descriptions of these objects, such as statements or percentage figures.
This method attempts to retain as far as possible the distances that exist between the categories of a variable with respect to its description by the respective other variable when generating a reduced solution.
Because typically a reduction into a two-dimensional space is desired, namely a depiction on a single plane, with this method a reduction from the original number of categories into two dimensions is achieved with respect to each variable.
When reducing the number of dimensions, there are different ways to achieve scaling. The focus can be placed on the depiction of the line variables or of the column variables. Thus, one can also influence whether objects or attributes are displayed with greater precision, or whether scaling should be symmetrical.
The output of a correspondence analysis is a depiction in which objects and their descriptions are displayed together as points on a single plane. The distances between the objects show their degree of dissimilarity, and this also applies to the distances between the attributes.
By contrast, the distances between objects and attributes cannot be interpreted. However, by interpreting the attributes as directions (coordinate axes), it can be seen how far the objects are represented within them.
PREREQUISITES
Correspondence analysis is based around a so-called contingency table which shows the relationship between both variables (e.g. objects and attributes). In purely mathematical terms, information can thus be displayed on the basis of a very small number of cases. For statistically reliable results, however, the conditions which apply here are the same as those which apply for descriptive statistics in general. Results that are based on less than 30 cases should generally not be displayed. Depending on general conditions (size of the population, degree of involvement of the participants, complexity of the survey), higher case numbers may also be necessary.
What is important is the proper interpretation of the output. The greatest danger lies in trying to interpret the distances between object and attribute positions and thus drawing incorrect conclusions.