G/TURF
TURF-ANALYSIS
THE PRODUCT
G/TURF facilitates the uncomplicated implementation of TURF analyses (Total Unduplicated Reach and Frequency). Even very difficult constellations, e.g. on account of a very large number of products, can be handled in a very short time.
FEATURES IN BRIEF
- Determination of product combinations with the highest net reach or frequency to support the determination of the optimal product portfolio
- Innovative genPlus algorithm for TURF analyses in completely new dimensions of speed
- Processing of tasks that were previously unmanageable
- Definition of must-haves and no-goes in any combination
- Tests for significant differences
- Calculation of the average reach that can be fed to an alternative (Shapley values)
OBJECTIVE
TURF means Total Unduplicated Reach and Frequency – and that is exactly what the analysis delivers.
In general the purpose of the analysis is to discover, out of a range of different offerings, those which, in combination, achieve the maximum reach. Thus for example, the manufacturer of a food product may wish to discover which range of flavor variants will reach the widest possible circle of purchasers.
Thus, a possible objective may be to identify, out of 10 different flavor variants, the 5 which will in combination achieve the largest number of purchasers (reach). These may not necessarily be the 5 variants which, when taken separately, have the highest share of purchasers. The analysis delivers the net share of purchasers for all possible combinations of 5 variants.
A further question is: what volumes will be generated by different combinations (frequency). In the above-mentioned example it is determined, for each combination of 5 variants, what volume of unit sales can be achieved.
SURVEY PROCEDURE
Intention to purchase is asked for all of the alternatives surveyed. This can be either binary (would buy/would not buy) or a scale question (would definitely buy, would probably buy, etc.). This data is used for calculating reach.
In order to project potential unit sales, respondents are then asked how frequently and/or in what quantities they would expect to buy their chosen alternatives.
Given the simplicity of the questions, the data for the analysis can be acquired by means of any commonly-used survey method (P&P, CAPI, CATI or online).
ANALYSIS
The procedure calculates the reach and quantities resulting from the formation of subgroups from an overall group of variants.
With increasing numbers of variants, the number of possible combinations rapidly increases to astronomical proportions. Therefore the alternatives included in the survey should be carefully vetted for relevance.
It is also possible to set limits on the combinations to be evaluated. Thus it is possible to consider e.g. only those combinations that contain a minimum of 3 and a maximum of 5 alternatives, and/or only those combinations can be considered that include or exclude specific alternatives.
The procedure generates a list displaying the reach and quantities for all combinations that meet the criteria. If combinations with varying numbers of alternatives are to be analyzed, the list is divided into sections containing the different numbers of alternatives in ascending order.
Thus for example, in a complete list covering 10 alternatives, every alternative is firstly shown individually, then all 2-way combinations, then all 3-way combinations, through to a combination of all 10 alternatives.
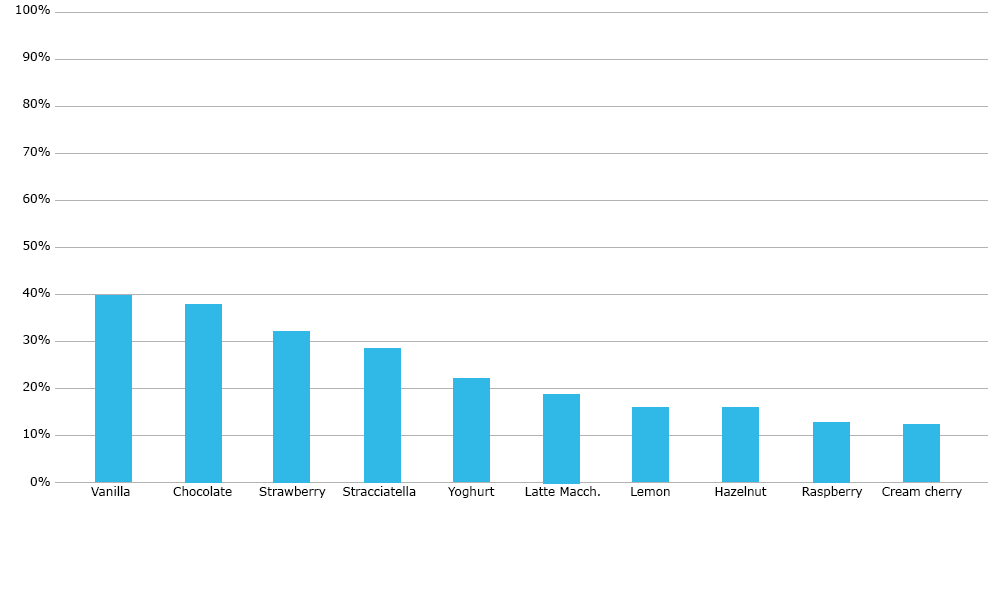
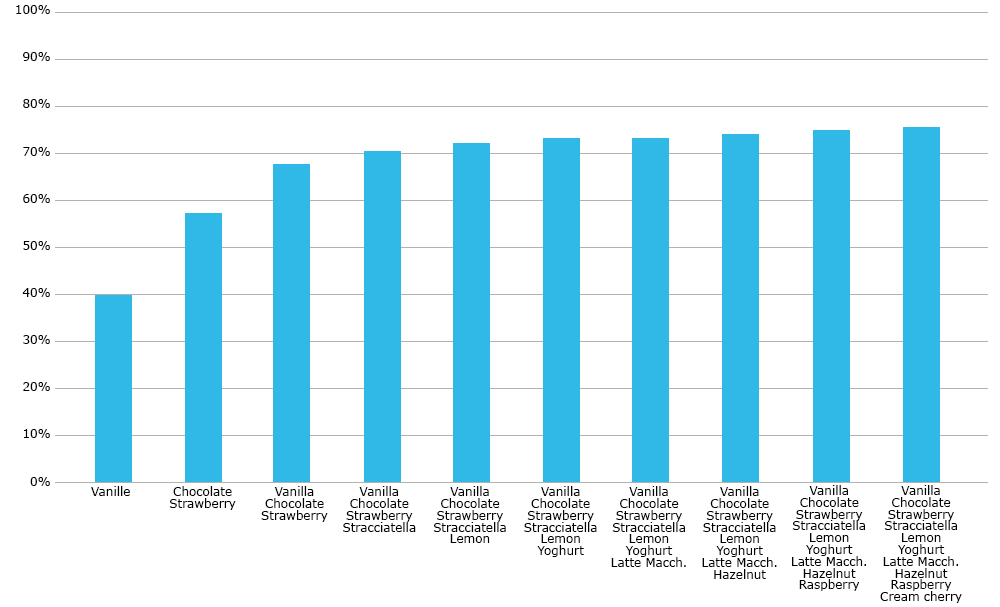
The Figures below demonstrate the results of a TURF analysis using the example of ice cream flavors. Figure 1 shows which ice flavors achieve the highest individual acceptance values. Figure 2 presents the reach of the most successful combinations of flavors. These do not always contain the flavors that achieved the highest individual scores. Thus, the most successful 2-way combination contains chocolate and strawberry but not the most popular individual flavor, vanilla. In the best 5-way combination one finds lemon, which was only ranked 7th on an individual basis. By contrast the yoghurt flavor, which was positioned above lemon individually, would result in a lower reach when included in a 5-way combination.