PRA
DRIVER ANALYSIS
THE PRODUCT
PRA (Penalty & Reward Analysis) is our tool for the analysis of non-linear influences on target values such as satisfaction, loyalty and image. It delivers a classification of the drivers and the extent of their influence. Now in unexpected, new speed dimensions!
FEATURES IN BRIEF
- Eliminates restrictions imposed by linear models
- Classification by “Delighter”, “Basic” and “Performance” drivers (based on Kano)
- Uncovers influence factors where a need for action exists or which open up new opportunities
- General avoidance of problems arising from multicollinearity due to the calculation of Shapley Values
- Now new speed dimensions even with a great many drivers: our PRA tool allows computing times of minutes and hours instead of months or even years through clever fragmentation into several smaller PRAs
OBJECTIVE
The objective of Penalty & Reward Analysis is to answer the question, how is one feature influenced by one or more other features? The relationship between features is not always linear, as is assumed in many other procedures (e.g. regression analysis, structural equation modeling).
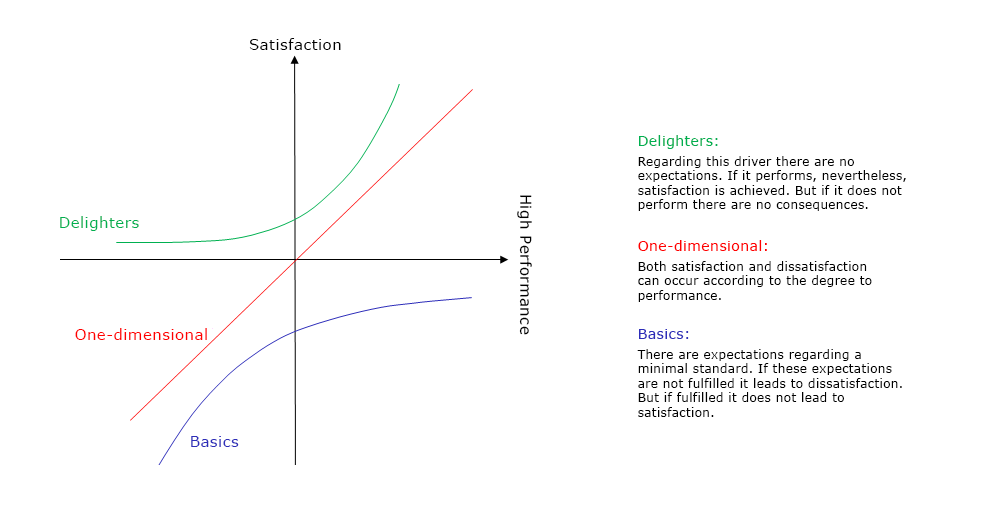
According to the Kano Model three types of drivers can be distinguished
- Basics:
There are expectations regarding a minimal standard. If these expectations are not fulfilled it leads to dissatisfaction. But if fulfilled it does not lead to satisfaction. - Delighters:
Regarding this driver there are no expectations. If it performs, nevertheless, satisfaction is achieved. But if it does not perform there are no consequences.
- One-dimensional:Both satisfaction and dissatisfaction can occur according to the degree to performance.
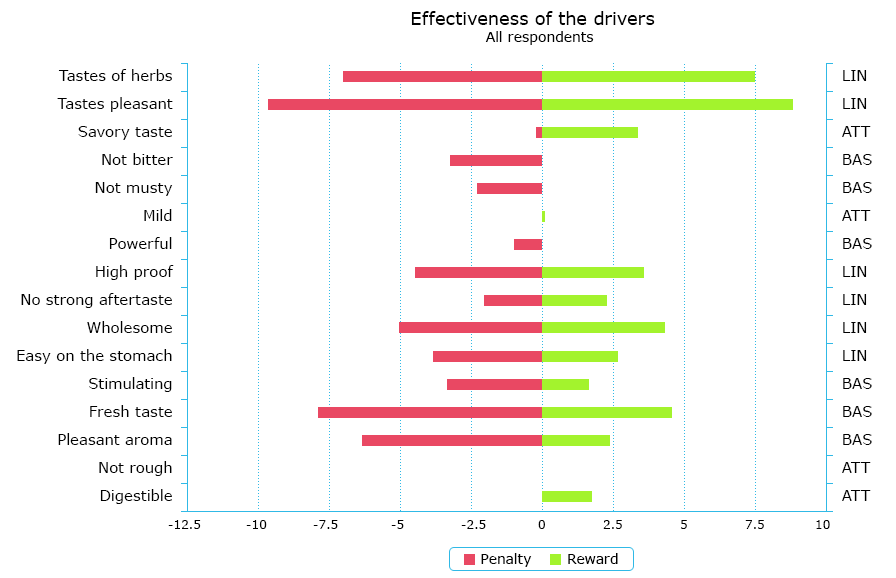
For each driver, the procedure determines how far poor ratings for this driver exclusively correspond to poor ratings for the dependent variable, i.e. a driver is penalized. Since the “penalty” can thus be unambiguously traced back to one driver, multicollinearity does not represent a problem. It is also tested how far good ratings for a certain driver exclusively correspond to good ratings for the dependent variable, i.e. a driver is “rewarded”.
The relationship arising from the amount of Penalty and Reward is decisive for determining the type of the driver. When Penalty is dominant it is a Basic Driver, when Reward is dominant it is a Delighter. When Penalty and Reward are roughly equal, it is a One-dimensional driver (illustration 2). From the relation of the sum of Penalty and Reward of a driver to the total of the sums of all drivers, the importance of the driver can also be derived.
Action Relevance Matrix
Graphical output in the form of an action relevance matrix (activation matrix) makes it easier to derive recommendations for action from the results of driver analyses. For this purpose, the importance of the drivers is shown on the x-axis and the mean value of the drivers (satisfaction, loyalty, image, etc.) on the y-axis and the area over the mean value of all driver strengths (x-axis) and all driver mean values (y- axis) divided into four areas.

This makes it very easy to read off the drivers that are of great importance (right area) and how they relate to the mean value of all drivers. If a driver is at the bottom right, there is a “need for action” for the variable. Delighter drivers in particular can have a disproportionately positive effect on the variable to be explained. If, on the other hand, a driver is located at the top right, care must be taken that these do not deteriorate, especially the basic driver. In order to further refine the classification, a gray area, i.e. an area with the average driver strength or the average driver mean values, can also be defined.
PREREQUISITES
The relationships between the independent variables and the dependent variable must be positive. Otherwise recoding is necessary.
The procedure divides the sample into three groups, “high”, “middle” and “low”, according to the levels of the dependent variable. The “high” and “low” groups must not be empty.
Unimaginable speed dimensions
With our PRA-Tool, new, unimaginable speed dimensions become real. The PRA is based on the very time-consuming calculation of Shapley Values. For this reason, their applicability had been limited to analyzes with up to 30 drivers. Even a few more drivers led to an increase in computing time by months or years. IfaD has developed a procedure and integrated it in the ADABOX, which also allows analyzes with significantly more drivers in a short time. So far, you’ve had to put days or months of computing time into the equation, so with the toolbox’s PRA analysis, you can now achieve nearly the same results in just a few minutes or hours.